Ch. 10: Tibbles
Key questions:
nonetibble: produces a dataframe w/ some other helpful qualities that have advantages overdata.frame- see
vignette("tibble")
- see
as_tibble: convert to a tibbletribble: transposed tibble - set-up for data entry into a tibble in codeprint: can use print to set how the tibble will print
nycflights13::flights %>%
  print(n = 2, width = Inf)
## # A tibble: 336,776 x 19
## year month day dep_time sched_dep_time dep_delay arr_time
## <int> <int> <int> <int> <int> <dbl> <int>
## 1 2013 1 1 517 515 2 830
## 2 2013 1 1 533 529 4 850
## sched_arr_time arr_delay carrier flight tailnum origin dest air_time
## <int> <dbl> <chr> <int> <chr> <chr> <chr> <dbl>
## 1 819 11 UA 1545 N14228 EWR IAH 227
## 2 830 20 UA 1714 N24211 LGA IAH 227
## distance hour minute time_hour
## <dbl> <dbl> <dbl> <dttm>
## 1 1400 5 15 2013-01-01 05:00:00
## 2 1416 5 29 2013-01-01 05:00:00
## # ... with 3.368e+05 more rows* Also can convert with `as.data.frame` or use `options`, see [10.5: Exercises], problem 6enframe: let’s you encode name and value, see 10.5: Exercises, problem 5 belowclass: for checking the class of the object- Though is not fully accurate, in that the actual object class of vectors is “base”, not double, etc., so kind of lies…
10.5: Exercises
1. How can you tell if an object is a tibble? (Hint: try printing mtcars, which is a regular data frame).
Could look at printing, e.g. only prints first 15 rows and enough variables where you can see them all, or by checking explicitly the class function23
2. Compare and contrast the following operations on a data.frame and equivalent tibble. What is different? Why might the default data frame behaviours cause you frustration?
- Tibbles never change type of input e.g. from strings to factors
- Tibbles never change names of variables, never creates row names
- Tibbles print in a more concise and readable format
- This difference is made more stark if working with list-columns
3. If you have the name of a variable stored in an object, e.g. var <- “mpg”, how can you extract the reference variable from a tibble?
var <- "var_name"

# Will extract the column as an atomic vector
df[[var]]
4. Practice referring to non-syntactic names in the following data frame by:
df <- tibble(`1` = 1:10, `2` = 11:20)a. Extracting the variable called 1.
df %>%
  select(1)
## # A tibble: 10 x 1
## `1`
## <int>
## 1 1
## 2 2
## 3 3
## 4 4
## 5 5
## 6 6
## 7 7
## 8 8
## 9 9
## 10 10b. Plotting a scatterplot of 1 vs 2.
df %>%
  ggplot(aes(x = `1`, y = `2`))+
  geom_point()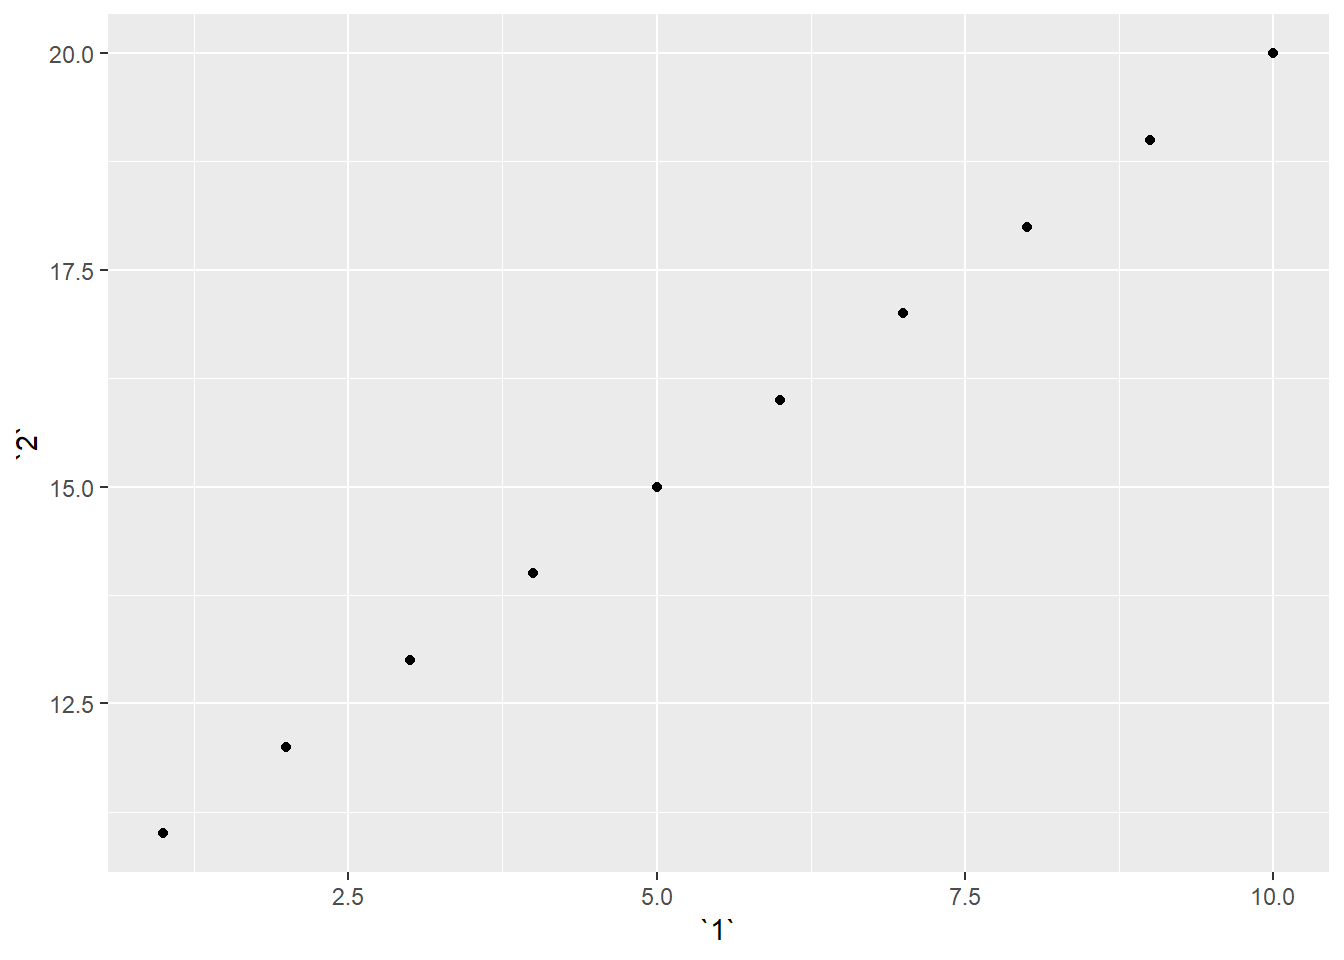
c. Creating a new column called 3 which is 2 divided by 1.
df %>%
  mutate(`3` = `1` / `2`)
## # A tibble: 10 x 3
## `1` `2` `3`
## <int> <int> <dbl>
## 1 1 11 0.0909
## 2 2 12 0.167
## 3 3 13 0.231
## 4 4 14 0.286
## 5 5 15 0.333
## 6 6 16 0.375
## 7 7 17 0.412
## 8 8 18 0.444
## 9 9 19 0.474
## 10 10 20 0.5d. Renaming the columns to one, two and three.
df %>%
  mutate(`3` = `1` / `2`) %>%
  rename(one = `1`,
         two = `2`,
         three = `3`)
## # A tibble: 10 x 3
## one two three
## <int> <int> <dbl>
## 1 1 11 0.0909
## 2 2 12 0.167
## 3 3 13 0.231
## 4 4 14 0.286
## 5 5 15 0.333
## 6 6 16 0.375
## 7 7 17 0.412
## 8 8 18 0.444
## 9 9 19 0.474
## 10 10 20 0.55. What does tibble::enframe() do? When might you use it?
Let’s you encode “name” and “value” as a tibble from a named vector
tibble::enframe(c(a = 5, b = 8))## # A tibble: 2 x 2
## name value
## <chr> <dbl>
## 1 a 5
## 2 b 8tibble::enframe(c(a = 5:8, b = 7:10))## # A tibble: 8 x 2
## name value
## <chr> <int>
## 1 a1 5
## 2 a2 6
## 3 a3 7
## 4 a4 8
## 5 b1 7
## 6 b2 8
## 7 b3 9
## 8 b4 106. What option controls how many additional column names are printed at the footer of a tibble?
- argument
tibble.width
options(tibble.print_max = n, tibble.print_min = m)
options(tibble.width = Inf)
options(dplyr.print_min = Inf) #to always show all rows
or could check a few other things such as if list-cols are supported↩