Ch. 18: Pipes (notes only)
pryr::object_sizegives the memory occupied by all of its arguments (note that built-in object.size does not allow measuring multiple objects so can’t see shared space). This function is actually shown in chapter 18: Pipes- Some functions do not work naturally with the pipe.
- If you want to use
assignwith the pipe, you must be explicit about the environment
- If you want to use
env <- environment()
assign("x", 100, envir = env)try,tryCatch,suppressMessages, andsuppressWarningsfrom base R all also do not work well
Other pipes = ‘T pipe’, %T>% that returns left-hand side rather than right. Will let the plot output, but then continues. Notice that this doesn’t work quite the same way for ggplot as ggplot does output something
rnorm(100) %>%
  matrix(ncol = 2) %T>%
  plot() %>%
  str()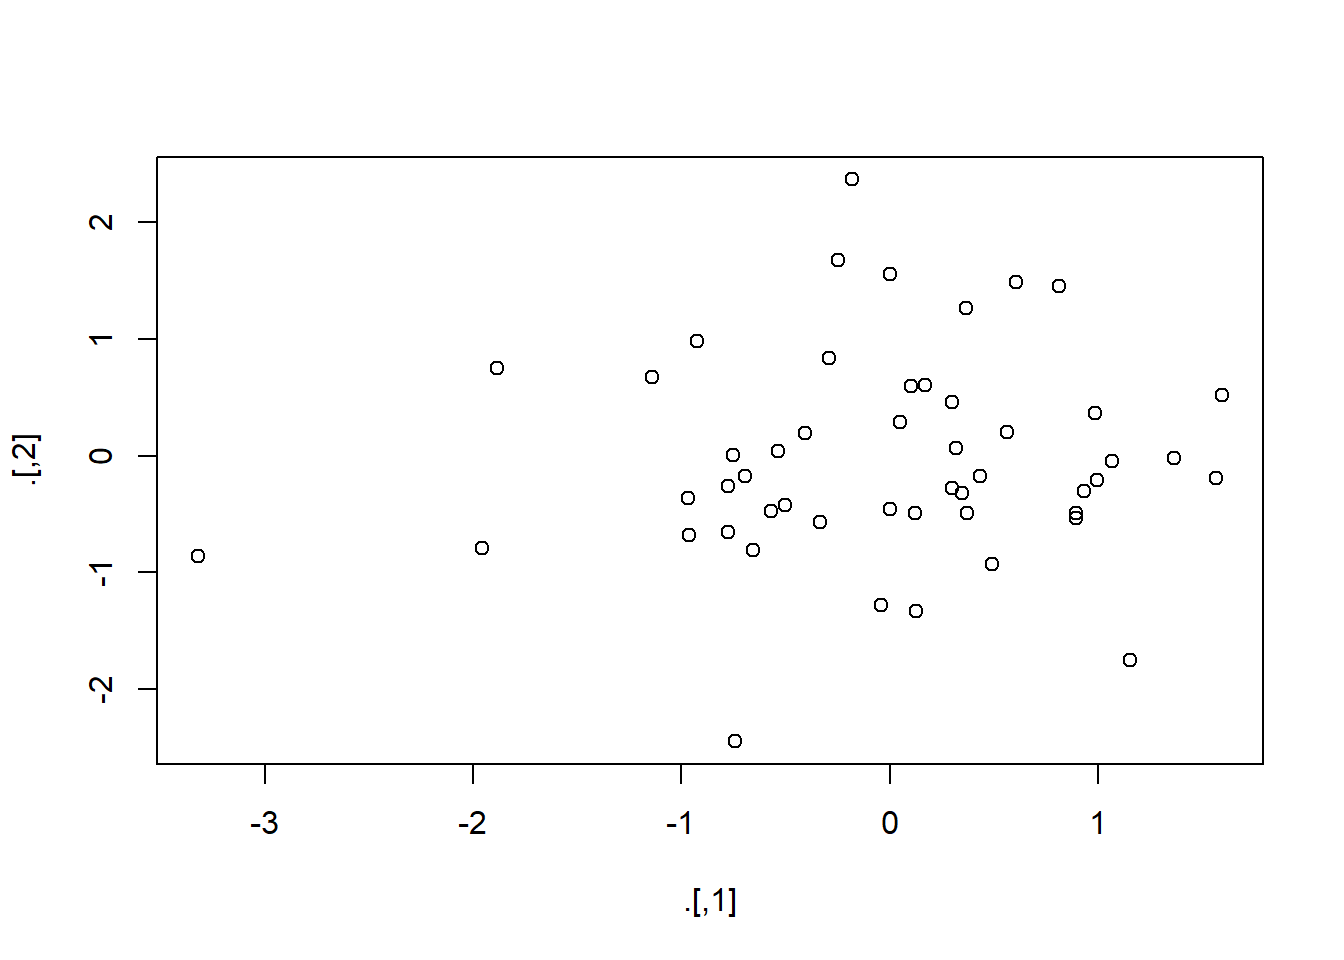
## num [1:50, 1:2] -0.25 -0.924 0.894 0.298 0.347 ...iris %>%
select(Sepal.Length, Sepal.Width) %T>%
plot() %>%
select(Sepal.Length) %>%
head(10)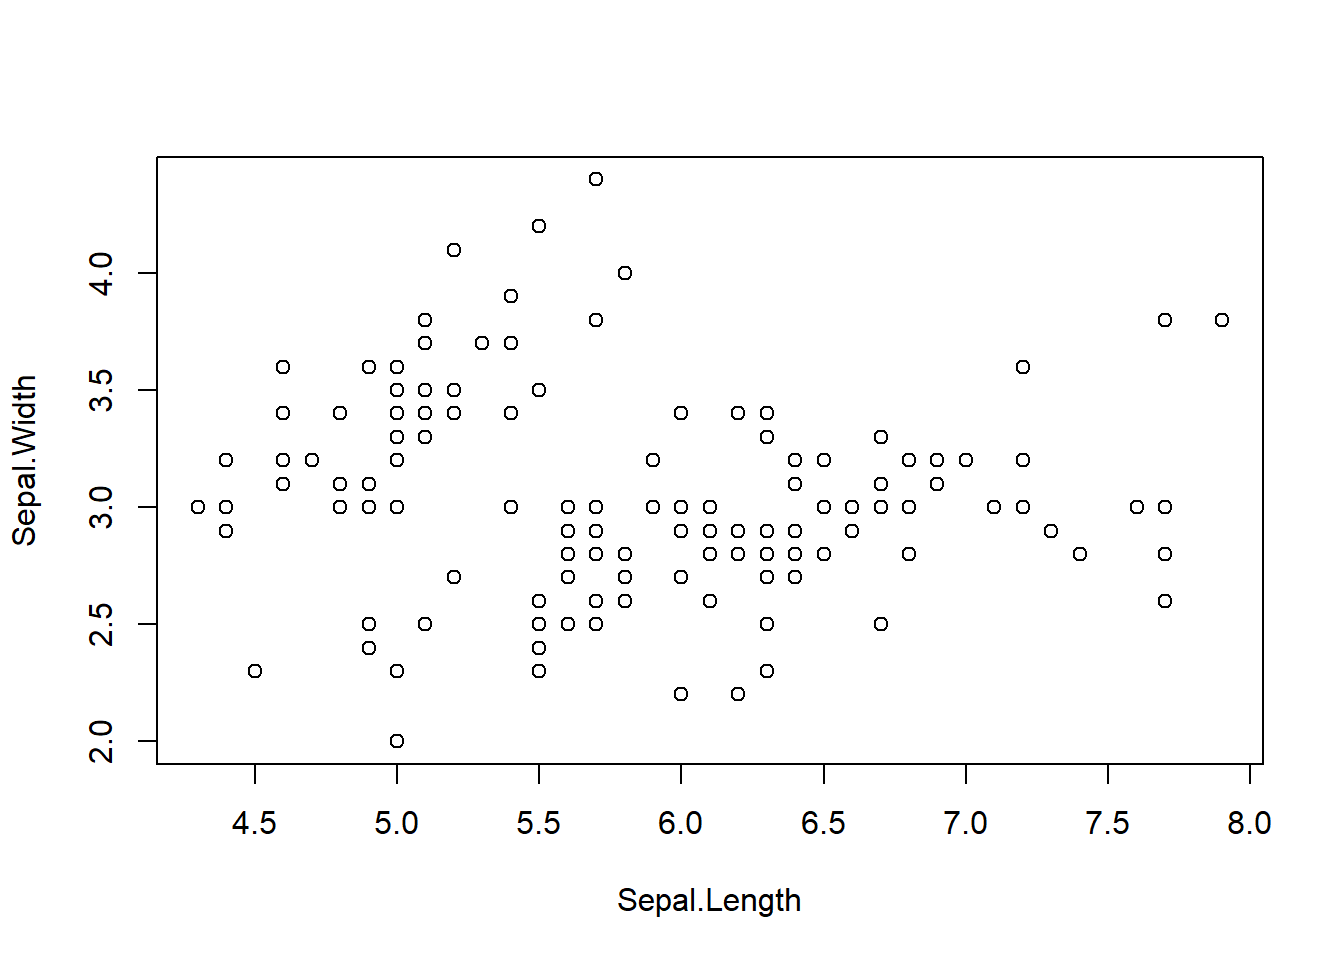
##    Sepal.Length
## 1           5.1
## 2           4.9
## 3           4.7
## 4           4.6
## 5           5.0
## 6           5.4
## 7           4.6
## 8           5.0
## 9           4.4
## 10 4.9%$%allows you to blow out the names of the arguments, I personally prefer using thewith()function for this instead as I find it to be a little more readable…- The two examples below are equivalent
mtcars %$%
  cor(disp, mpg)
## [1] -0.8475514mtcars %>%
with(cor(disp, mpg))## [1] -0.8475514